Empowering Your Website: A Comparative Guide to the Top Web Analytics Tools

Table of Contents
- What do Web Analytics Tools do?
- Broad Categories of Web Analytics Tools
- Top 10 Web Analytics Tools Today as per Market Research
- How to Choose the Right Web Analytics Tool?
- Conclusion
Web analytics tools are like digital assistants for your website, constantly collecting and analyzing data about how visitors interact with it. They provide valuable insights into various aspects, helping you understand who your audience is, what they do on your site, and where things could be improved. website owners, marketers, and analysts track and analyze the performance of their websites. These tools collect, measure, and analyze data related to website traffic and user behavior. The insights gained from web analytics can be used to understand how users interact with a website, optimize content, improve user experience, and make data-driven decisions to achieve business goals.
What do Web Analytics Tools do?
Websites today are filled with content up to the brim and web analytics tools act as the vigilant observers, silently collecting data, whispering insights, and ultimately helping you understand the heartbeat of your online presence. But what exactly do they do? Buckle up, for we’re diving into the fascinating world of web analytics!
Lifting the Hood: Data Collection at its Finest
Imagine your website as a bustling marketplace. People come from different places (referral sources), browse various stalls (pages), and sometimes make purchases (conversions). Web analytics tools act like hidden cameras, meticulously recording every action. They track:
Visitor Origins: Where do your visitors come from? Search engines, social media, or directly typing your URL? Knowing this helps tailor your marketing efforts for different channels.
Page Views & Navigation: Which pages are popular? Do visitors explore deeply or bounce after one hop? Understanding navigation patterns helps optimize user experience and content flow.
Time Spent & Engagement: Are visitors glued to your site or quickly clicking away? Time spent and clicks reveal content engagement and potential pain points.
Conversions & Goals: Did visitors complete desired actions like buying products, subscribing to newsletters, or contacting you? Tracking conversions measures your website’s effectiveness in achieving goals.
From Raw Data to Meaningful Insights: The Power of Analysis
But data alone is just numbers on a screen. Web analytics tools work their magic by transforming this raw data into actionable insights. They:
Calculate Key Metrics: Bounce rate, conversion rate, average time on site – these metrics, derived from raw data, paint a picture of overall website performance.
Segment Your Audience: Dive deeper by segmenting visitors based on demographics, interests, referral sources, or behavior. This helps personalize your website and marketing messages.
Funnel Analysis: Visualize the steps users take towards conversions, identifying drop-off points and optimizing the conversion funnel.
Path Analysis: See how visitors navigate your website, uncovering unexpected journeys and optimizing the user flow.
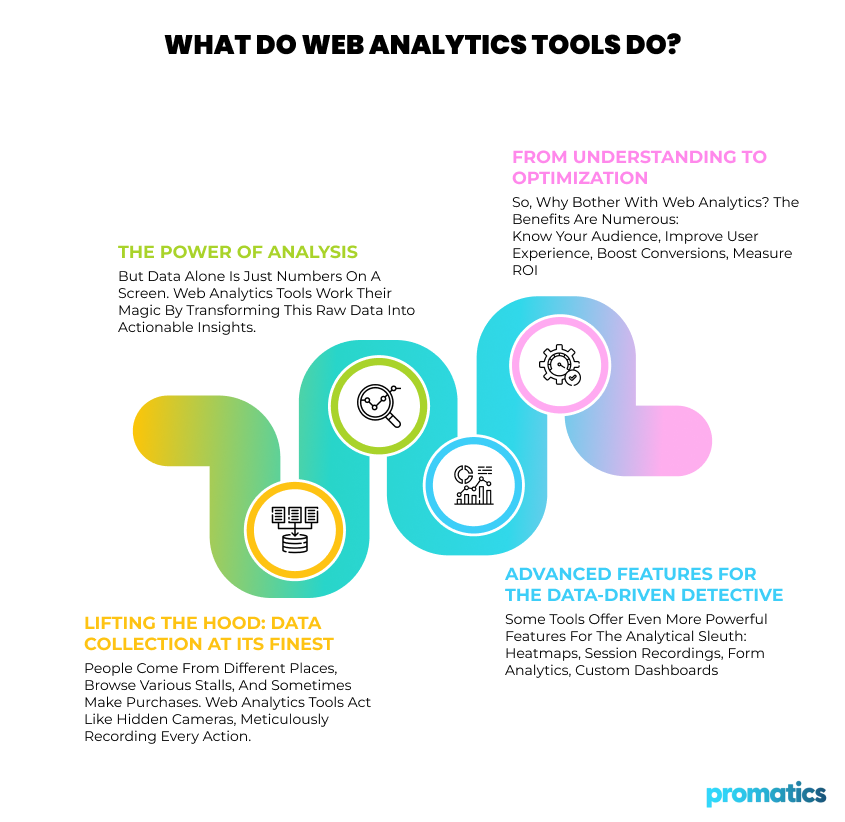
Advanced Features for the Data-Driven Detective
Some tools offer even more powerful features for the analytical sleuth:
Heatmaps: Visualize where visitors click, scroll, and focus their attention, revealing website usability issues and areas of high engagement.
Session Recordings: Watch real user recordings to see how they interact with your site, offering a firsthand glimpse into their experience.
Form Analytics: Analyze form submissions to identify completion rates and pinpoint fields causing friction.
Custom Dashboards: Tailor dashboards to display the metrics and insights most relevant to your specific goals.
The Benefits: From Understanding to Optimization
So, why bother with web analytics? The benefits are numerous:
Know Your Audience: Uncover who your visitors are, what they like, and how they behave, allowing you to tailor your content and marketing strategies.
Improve User Experience: Identify areas where users struggle and make changes to improve navigation, content clarity, and overall flow.
Boost Conversions: Track the performance of marketing campaigns and website elements to optimize them for higher conversion rates.
Measure ROI: Analyze the effectiveness of your website and marketing efforts to see what’s working and what’s not, improving your overall return on investment.
Broad Categories of Web Analytics Tools
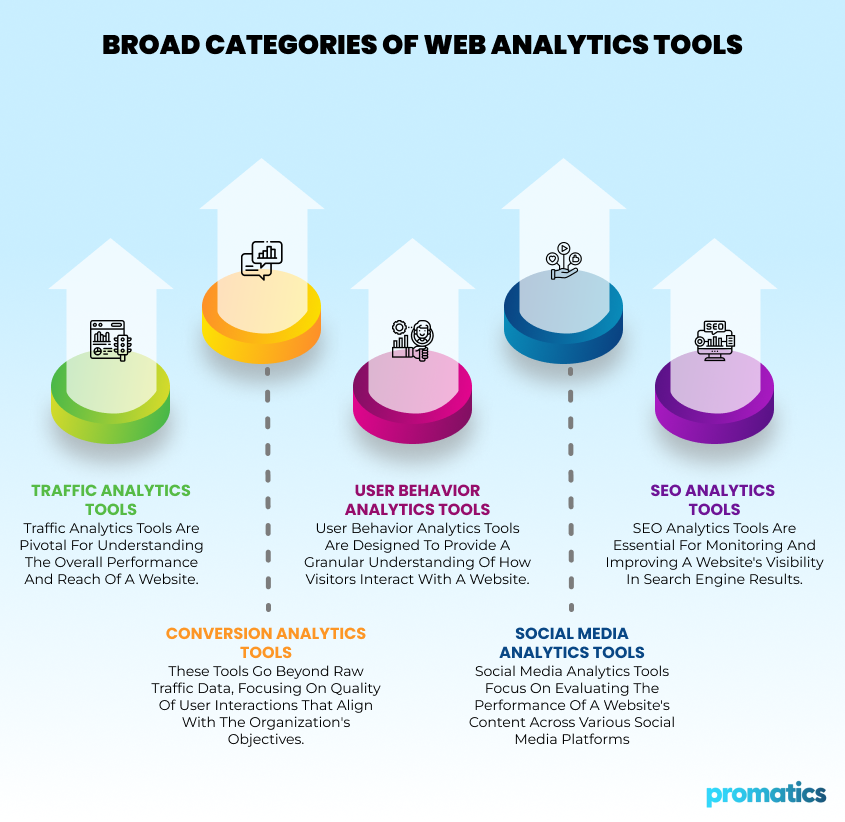
1. Traffic Analytics Tools:
Traffic analytics tools are pivotal for understanding the overall performance and reach of a website. These tools delve into quantitative data, offering insights into the volume and nature of incoming traffic. The primary goal is to assess the popularity of the site and identify patterns in user behavior. Google Analytics, one of the most widely used tools in this category, provides a wealth of information. It offers a comprehensive view of the total number of visitors, page views, bounce rates, and the sources of traffic, be it direct visits, organic searches, or referrals. These metrics empower website owners to gauge the effectiveness of their online presence and marketing strategies. Examples include Google Analytics and Matomo.
2. Conversion Analytics Tools:
Conversion analytics tools are indispensable for businesses aiming to understand how effectively their website converts visitors into customers or achieves other predefined goals. These tools go beyond raw traffic data, focusing on the quality of user interactions that align with the organization’s objectives. Key metrics in this category include conversion rates, goal completions (such as purchases or form submissions), and funnel analysis. By tracking user journeys and interactions, businesses gain insights into the areas that drive successful conversions and those that may need optimization. Popular examples of such tools ara kissmetrics and Optimizely.
3. User Behavior Analytics Tools:
User behavior analytics tools are designed to provide a granular understanding of how visitors interact with a website. These tools offer insights into navigation patterns, engagement levels, and the overall user experience. Heatmaps, session recordings, time on page, and click-through rates are key metrics in this category. Heatmaps visually represent user interactions, while session recordings allow a detailed review of individual user journeys. Time on page and click-through rates provide quantitative measures of engagement and interaction. Some examples are Hotjar, Crazy Egg and FullStory.
4. Social Media Analytics Tools:
Social media analytics tools focus on evaluating the performance of a website’s content across various social media platforms. They play a crucial role in understanding how effectively a brand’s content resonates with its social media audience.
Metrics such as social engagement (likes, shares, comments), referral traffic from social media, and follower growth are vital in social media analytics. These metrics help businesses assess the impact of their social media efforts on website traffic and overall brand visibility. Hootsuite, a widely used social media management platform, provides analytics features for monitoring social media performance. Buffer and Sprout Social are other examples of tools that integrate social media analytics to enhance social media strategy.
5. SEO Analytics Tools:
SEO analytics tools are essential for monitoring and improving a website’s visibility in search engine results. They help businesses optimize their online content to enhance search engine rankings and increase organic traffic. Key metrics in this category include keyword rankings, organic search traffic, backlink analysis, and on-page SEO factors. These metrics provide insights into the effectiveness of SEO strategies and identify areas for improvement.
SEMrush, known for its comprehensive suite of SEO tools, is widely used for keyword research, backlink analysis, and competitor benchmarking. Ahrefs and Moz are also prominent SEO analytics tools offering features that cater to various aspects of search engine optimization.
Top 10 Web Analytics Tools Today as per Market Research
1. Google Analytics
Google Analytics is a robust web analytics platform offering a wide range of features to help businesses understand and optimize their online presence. Google Analytics provides detailed insights into website traffic. Users can track the number of visitors, page views, and bounce rates. The platform categorizes traffic sources, distinguishing between direct, organic, referral, and paid sources. This information is invaluable for understanding user behavior and optimizing marketing strategies. Enhanced e-commerce tracking in Google Analytics allows businesses to monitor and analyze conversion-related metrics. This includes tracking online transactions, measuring revenue, and assessing the performance of specific goals such as form submissions or sign-ups. Businesses can set up custom conversion goals tailored to their unique objectives.
How much does Google Analytics cost?
Google Analytics offers two main options: a free plan and a paid plan called Google Analytics 360 (GA360). Let’s break down the features and pricing for each:
Google Analytics (Free Plan):
The free plan of Google Analytics is suitable for small businesses and websites with low to moderate traffic.
Features:
- Traffic reporting: Track website traffic, including sources, page views, time on site, and bounce rate.
- Conversion tracking: Set up goals to track user actions like sign-ups, purchases, and contact form submissions.
- Audience insights: Understand your audience demographics, interests, and behavior.
- Custom reports and dashboards: Create personalized reports to visualize your data and track key metrics.
- Integrations: Connect with other Google products and third-party apps.
Limitations:
- Limited data storage (2 months)
- Limited data sampling for high-traffic sites
- No custom dimensions or metrics
- No priority support
Google Analytics 360 (Paid Plan):
GA360 is best for large enterprises with high traffic volumes, complex data needs, and a strong desire for advanced analytics and customization. Google Analytics 360 requires a minimum contract commitment. Google offers flexible pricing options for GA360 based on your specific needs and data volume.
Features:
- All features of the free plan, plus:
- Unlimited data storage
- No data sampling
- Custom dimensions and metrics
- Advanced segmentation
- Attribution modeling (understanding which touchpoints contribute to conversions)
- BigQuery integration (for advanced data analysis)
- Custom alerts and reports
- Priority support
Pricing:
- Starts at $12,500 per month or $150,000 per year (custom quotes available for larger companies)
2. Mixpanel
Mixpanel is a product analytics platform that helps you track user behavior and engagement within your mobile and web applications. It provides insights into how users are interacting with your product, allowing you to identify areas for improvement and optimize your user experience. Mixpanel is widely used by product teams, growth marketers, and analysts to drive data-driven decision-making.
Prominent Features:
- Funnel analysis: Visualize the steps users take towards completing desired actions, like making a purchase or signing up.
- Cohort analysis: Analyze specific groups of users based on shared characteristics to understand their behavior.
- Retention analysis: Track how many users return to your product over time and identify factors influencing churn.
- User segmentation: Group users based on various criteria to tailor your product and marketing efforts.
- Custom events and properties: Track specific user interactions and attributes to gain deeper insights.
- A/B testing: Experiment with different features and designs to see what resonates best with users.
- Integrations: Connect with other tools and platforms to centralize your data.
How much does Mixpanel cost?
Free plan: Includes basic features and 20 million monthly tracked events. Suitable for small startups and individual projects.
Growth plan: Starts at $20 per month and allows unlimited saved reports. Offers additional features like funnels, cohorts, and group analytics.
Enterprise plan: Custom pricing for large organizations. Offers dedicated support, data governance, and advanced security features.
Special Tip: Mixpanel offers growth plans completely free for the first year to Startups that were founded less than 5 years ago, with up to $8M in total funding.
3. Hubspot
HubSpot is a powerful platform offering a suite of software solutions designed to help businesses grow better. It is an all-in-one inbound marketing, sales, and customer service platform designed to help businesses attract, engage, and delight customers. It provides a suite of tools to manage various aspects of the customer journey, from marketing and sales to customer support and relationship management. HubSpot is known for its user-friendly interface and the integration of multiple functions into a single platform.
Here’s a breakdown of HubSpot’s features
Marketing Hub:
Enables the creation and management of landing pages and blog content effortlessly. Design visually appealing pages without the need for coding. Facilitates the publication of blog posts to attract and nurture leads effectively.
Sales Hub:
Empowers efficient management of the sales pipeline. Customize sales processes and workflows to suit specific needs. Utilize live chat for real-time interactions, converting them into leads.
Service Hub:
Facilitates seamless provision of customer service across diverse channels. Offers self-service options through a knowledge base and community forum. Keeps track of customer satisfaction and aids in building strong relationships.
CMS Hub:
Provides a user-friendly platform for building and managing a modern website without coding expertise. Optimizes the website for search engines, delivers personalized content, and offers insights into website performance.
Operations Hub:
Enhances operational efficiency through workflow automation. Allows for the integration of HubSpot data with other applications, ensuring consistency and reliability in processes.
Commerce Hub:
Simplifies the establishment and management of an online store. Ensures secure payment processing, provides personalized shopping experiences, and offers insights into eCommerce performance for informed decision-making.
How much does Hubspot cost?
HubSpot offers a freemium model, with a free plan that includes limited features and paid plans with more advanced features and functionality. The paid plans are available in three tiers: Starter, Professional, and Enterprise. Each tier offers different features and pricing options, depending on your business needs and team size. Here’s a quick overview:
- Starter plan: Starts at $18 per month for 1,000 contacts. Includes core features for marketing, sales, and service.
- Professional plan: Starts at $1781 per month for 2,000 contacts. Includes all features of the Starter plan, plus advanced automation, reporting, and integrations. This is for up to 5 users.
- Enterprise plan: Strats at $5000 per month for 10,000 contacts. Includes all features of the Professional plan, plus dedicated support, advanced security, and custom development.
4. Hotjar
Hotjar is a comprehensive analytics and feedback platform that provides insights into user behavior on websites. It offers tools for website heatmaps, session recordings, surveys, and feedback collection. Hotjar helps businesses understand how users interact with their websites, identify areas for improvement, and make data-driven decisions to enhance the user experience.
Prominent Features
Heatmaps: Visualize where users click, scroll, and focus their attention, revealing popular content and potential roadblocks.
Session Recordings: Watch real user recordings to see how they navigate your site, uncovering usability issues and identifying friction points.
Form Analytics: Analyze form submissions to identify completion rates and pinpoint fields causing abandonment.
Surveys and Feedback: Capture user feedback directly on your website through polls and surveys, gaining valuable insights into their thoughts and preferences.
Funnels: Track user journeys through specific actions you define, identifying drop-off points and optimizing conversion paths.
How much does Hotjar cost?
Hotjar offers a freemium model and three paid plans:
- Free Plan: Includes basic Heatmaps and limited recordings, suitable for low-traffic websites or personal projects.
- Plus Plan: Starts at $32/month for 100 daily sessions, offering unlimited Heatmaps, Session Recordings, Funnels, and basic Filters.
- Business Plan: Starts at $80/month for 500 daily sessions, includes everything in Plus Plan, plus advanced Filters, Integrations, User Attributes, and Frustration Signals.
- Scale Plan: Starts at $171/month for 500 daily sessions. It includes funnels, console tracking and trends.

5. Matomo
Matomo is an open-source web analytics platform that gives you complete ownership and control over your data. Unlike some other analytics tools that collect and store your data on their servers, Matomo allows you to host the software on your own server or use their cloud-based option, ensuring your data privacy and security.
Key Features:
- Website Traffic Tracking: Track key metrics like page views, unique visitors, bounce rate, and time spent on site.
- Conversion Tracking: Monitor actions like signups, purchases, and other goals to measure your website’s effectiveness.
- Visitor Engagement: Gain insights into how users interact with your website through heatmaps, session recordings, and form analytics.
- Customizable Dashboards: Create personalized dashboards to visualize the data that matters most to you.
- Advanced Segmentation: Analyze data for specific user groups based on demographics, interests, and behavior.
- Privacy-focused: Complies with strict data privacy regulations like GDPR and CCPA.
How much does Matomo cost?
Matomo offers two main pricing options:
- On-Premise: This is the free, self-hosted version where you install and manage the software on your own server. This option gives you complete control over your data and customization, but requires some technical expertise.
- Cloud: This is the paid, cloud-hosted version where Matomo takes care of hosting and maintenance. It offers various plans starting from €19 per month, with features like increased data storage, priority support, and advanced security.
6. Kissmetrics
Kissmetrics is a customer engagement and analytics platform designed to help businesses understand user behavior across their websites and applications. It enables businesses to make data-driven decisions that drive growth and foster long-term customer relationships. It also allows A/B testing for feature and design experimentation and is popular due to integrations with other tools and platforms.
Features:
User-Focused Analytics:
Tracks individual user journeys instead of just page views or isolated events.
Connects anonymous activity with identified users after signup.
Allows segmentation based on various user properties for deeper insights.
Actionable Insights:
Identifies high-value user acquisition channels and segments.
Analyzes user behavior to optimize product experience and conversion rates.
Tracks user retention and helps prevent churn.
Key Performance Indicators (KPIs):
- Tracks effectiveness of marketing campaigns and landing pages.
- Identifies revenue-generating search terms.
- Analyzes user flow through conversion funnels (signup, upgrade, etc.).
- Monitors user retention and identifies at-risk users.
- Compares behavior of converting vs. non-converting users.
- Measures feature adoption and engagement.
How much does Kissmetrics cost?
| Plan | Silver | Gold | Platinum |
|---|---|---|---|
| Price | $199/month | $499/month | Custom pricing |
| Best For | Small teams | Medium-sized teams | Large teams |
| Monthly Events | Up to 2 million | Up to 5 million | Custom |
| Seats | 3 | 10 | Custom |
| Populations | 10 | 20 | Custom |
| Features | Core reporting, Email support, 12-month data retention | Core reporting, A/B testing, Email support, 24-month data retention | All features, Dedicated support (Email, Chat, Account Manager), 36-month data retention |
7. Clicky
Clicky is a great option for website owners who value privacy, transparency, and actionable insights while maintaining GDPR compliance. Clicky goes beyond typical website analytics. It does not collect personal data and does not track cookies, IP addresses, or other PII are stored by default. It ensures your data reflects real website visitors by blocking bots and referrer spam. The biggest differentiator is that it provides insights while respecting user privacy. It can also capture data even if visitors use ad-blockers.
Key Features:
- Real-time visitor monitoring: Track user activity as it happens.
- Detailed visitor and action logs: See individual page views, events, and visitor journeys.
- Heatmaps: Visualize where visitors click and engage on your website.
- Uptime monitoring: Get notified immediately if your website goes down.
- Security and anti-fraud options: Log additional data for enhanced security if needed.
- Customizable dashboards and reports: Analyze data your way.
- Integrations: Connect with various marketing and business tools.
How much does Clicky cost?
Clicky offers both free and paid plans, with different tiers based on the number of websites you track and daily page views. It offers all new accounts a free 21-day trial of the Pro plan with access to all features. One of the major highlights of Clicky is that it also offers white label analytics solutions with custom pricing.
Free Plan:
Track 1 website with up to 3,000 daily page views (total).
Includes basic features like individual visitor tracking, real-time data, and basic reports.
No access to premium features like heatmaps and uptime monitoring.
Paid Plans:
| Plan | Websites | Daily Pageviews | Monthly Pricing |
|---|---|---|---|
| Pro | 10 | 30,000 | $9.99 |
| Pro Plus | 10 | 30,000 | $14.99 |
| Pro Platinum | 30 | 100,000 | $19.99 |
| Custom | Up to 1,000 | Up to 20 Million | Custom Pricing |
8. Woopra
Woopra is a comprehensive customer analytics platform designed to help businesses understand and engage with their users in real-time. With a focus on providing actionable insights, Woopra tracks user behavior across websites, mobile apps, and other digital touchpoints. Woopra stands out for its ability to unify data from various sources, providing a holistic view of customer interactions. The platform also supports automation and personalized messaging, allowing businesses to create targeted campaigns based on user behavior.
Prominent Features:
- Tracking journeys: Allows you to see how users move through your site, emails, and app, uncovering pain points and hidden opportunities.
- Predictive Analysis: Identify users at risk of leaving before they do, allowing you to intervene and improve retention.
- Grouping: Segment users based on actions and behavior, allowing you to tailor marketing and experiences for each type of customer.
- Live data, live insights: Provides real-time data to understand trends and react instantly to changes in user behavior.
- Make data-driven decisions: Provides insights to personalize experiences, optimize product features, and drive overall growth.
How much does Woopra cost?
Woopra offers different pricing plans to accommodate various business needs. All plans include core analytics features like visitor tracking, reports, and dashboards. Pro plan offers a 14-day free trial as well.
| Plan | Actions/mo | Data Retention | Price | Features |
|---|---|---|---|---|
| Core (Free) | 500K | 90 days | Free | Basic analytics, 30+ integrations |
| Pro | 5 million | 2 years | $999 | Advanced analytics, drill-down reports, automations, data loader |
| Enterprise | 50 million+ | Customizable | Custom | Custom data warehouse sync, new workflows, organization tracking, dedicated support |
9. Chartbeat
Chartbeat is a real-time analytics platform designed to help publishers and media organizations understand and optimize the performance of their digital content. It provides insights into how audiences engage with articles, videos, and other content in real-time, allowing publishers to make data-driven decisions to increase reader engagement and drive revenue.
Key features of Chartbeat:
- Real-time Dashboard: See how your audience engages with content across platforms, channels, and devices. Monitor trends, filter data by demographics, and integrate with social media platforms.
- Conversion Dashboard: Track key conversions (subscriptions, registrations) and understand user journeys through content-first attribution models. Optimize editorial and product strategies for better conversions.
- Native App Integration: Analyze in-app audience engagement like section preferences, notification effectiveness, and content performance. Improve app experience and push notifications.
- Historical Dashboard: Evaluate content performance and valuable trends over time. Compare metrics, track KPIs, and get automated insights about notable changes.
- Video Dashboard: Analyze video engagement metrics like starts, playrate, and completion rates. Optimize video placement and distribution based on audience preferences.
- Multi-Site View: Track performance across multiple websites in one dashboard. Compare metrics, benchmark performance, and identify trends across your network.
How much does Chartbeat cost?
Chartbeat does not display the plans and the pricing for its services explicitly on its website. Rather they request you to reach out to them to know about how much it costs
10. GoSquared
GoSquared empowers you to truly understand your website visitors without the complexity of other tools. Its user-friendly dashboard delivers real-time and historical traffic data, engagement metrics, and campaign performance. Track popular content, user actions, and even device usage to optimize your website experience. Make informed decisions with smart predictions and insightful comparisons, all while respecting user privacy with GDPR compliance. GoSquared integrates seamlessly with your favorite tools and lets you export data for deeper analysis.
Key features:
- Real-time Analytics & Historical Reporting: Understand website performance in the moment and over time with comprehensive dashboards and historical data.
- Engagement & Content Insights: Track user behavior, identify popular content, and measure engagement to optimize your website for visitors.
- Advanced Tracking & Analytics: Deep dive into user actions, campaign performance, and device/browser usage to gain valuable insights.
- Actionable Predictions & Comparisons: Forecast future traffic and compare performance against prior periods to make informed decisions.
- Privacy-Focused & Compliant: Respect user privacy with GDPR compliance and avoid collecting personal information.
- Customizable & Easy-to-Use: Set up analytics quickly, choose data points that matter, and access information on any device.
- Powerful Integrations & Export: Connect GoSquared with your favorite tools and easily export data for further analysis.
How much does GoSquared cost?
| Plan | Price per month | Page views | Projects |
|---|---|---|---|
| Starter | $9 | 100,000 | 3 |
| Standard (Most Popular) | $24 | 500,000 | 5 |
| Pro | $49 | 1,000,000 | 10 |
| Scale | $99 | 2,500,000 | 20 |
How to Choose the Right Web Analytics Tool?
With so many tools available, the best choice depends on your needs and budget. Consider factors like:
1. Your Business Goals:
- What do you want to achieve with your website? (e.g., increase sales, leads, engagement)
- What key metrics will you track to measure success? (e.g., page views, conversion rates, bounce rates)
2. Your Website Traffic:
- How much traffic does your website get per month?
- What are the different sources of your traffic? (e.g., organic search, social media, referrals)
3. Your Budget:
- How much are you willing to spend on a web analytics tool?
- Are there any free or open-source options that meet your needs?
4. Your Technical Expertise:
- How comfortable are you with setting up and using web analytics tools?
- Do you need a tool with a user-friendly interface and good customer support?
5. Features and Integrations:
- What features are important to you? (e.g., real-time tracking, heatmaps, conversion tracking)
- Does the tool integrate with other marketing tools you use?
In conclusion
The choice of the best web analytics tool depends on the specific needs and objectives of the user or organization. Google Analytics stands out as a versatile and widely-used platform, offering a comprehensive set of features suitable for various users. For paid tools, each tool has its strengths, making it essential to evaluate features, pricing, and individual requirements when selecting the most suitable web analytics solution.
