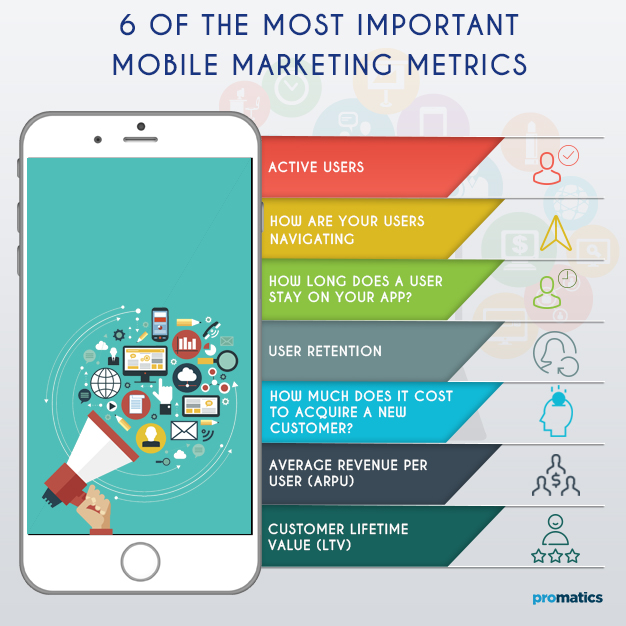
6 of the Most Important Mobile Marketing Metrics
For successful mobile marketing implementation, it is important to constantly analyse what is going on within an application. Assessing how it is being used by your end users and tracking other metrics allows you to implement the right upgrades, include more relevant features and maintain user loyalty.
Many apps, depending on the category they belong to rely on specific KPIs. However, there are a few critical mobile marketing metrics that every application must consider –
1. Active Users
Getting a user to download your application is the easiest of the challenges you will face. However, getting him to come back and use it on a regular basis is the real test. This is why, only relying on the number of installations may not provide you with accurate insight on its user base. You also need to take into account the number of Monthly Active Users (MAU) and Daily Active Users (DAU) your app encounters.
You want to get to know as much about these apps as possible. How they use the app, their demographics, preferences, how much time they spend on your app, etc. This will allow you to fine-tune your targeting and also define customized actions with an aim to encourage more loyalty.
Furthermore, as important as it is to have a high number of active users, it is also critical that you attract newer ones. Keep track of decreasing number of new or existing users and you will be able to re-assess your approach for mobile marketing approach.
2. How are Your Users Navigating Through the App
Mobile marketers should be able to keep track of how the app users are navigating the application. Which on the screens of the app result in maximum loss of customers? This is a highly critical piece of information. Understanding which screens make your users stay and which don’t can say a lot about an app. For instance, in a game, if it a specific level after which users tend to stop using the app, it may be an indicator that the particular level or stage is too difficult. In case of a productivity app, you may be able to re-think how you conceived or approached the app. Also assess if the user is navigating each screen in the flow that was intended by the developers. Rely on heat maps to gain significant information in this regard.
3. How Long Does a User Stay on your App?
The average session length of your app is an indicator of how well received it is among its users. Users that come and leave in a short time frame are not finding what they are looking for in your app. If you find that this is happening in majority of the cases, chances are you are not communicating the core functionality of your app the right way. Revisit your communications on the app website or app store and make necessary changes.
Before you make any assessments have an understanding of what a normal session length should be. For instance, if your app forecasts weather, it is normal for a user to spend as little as a minute on it or as much as 10 minutes on it. On the other end, a productivity app may expect longer session times.
4. User Retention
Statistics suggest that as many as 20% of the apps are abandoned after they are used for the first time. You want to prevent your app from heading to the mobile app graveyard. User retention refers to the percent of users that come back to their app after their first visit. In addition to having these figures handy, you also want to assess how often they come back to your app. The more loyal your customers are, the easier it will be for you to implement monetization strategies around your app.
5. How much does it Cost to Acquire a New Customer?
Knowing your Customer Acquisition Cost (CAC) is critical because it allows you to budget for your advertising. This is calculated by adding all your expenses that go into acquiring new users within a given time frame and dividing it by the number of customers you actually acquired in that phase. Expenses include cost of marketing, infrastructure, advertising, hiring sales representatives, etc.
6. Average Revenue Per User (ARPU)
It’s very important that users start using your application, are committed to it and carry on using it. It is just as important is to know how to make the app profitable. The ARPU metric is used for this purpose. ARPU is calculated by adding up all the revenue obtained from users (i.e. app’s price, in-app purchases, ads, etc.) and then dividing this figure by the total number of users.
7. Customer Lifetime Value (LTV)
And how do we calculate user value? It’s the result of multiplying ARPU by the average customer lifetime we expect from a user. This information will enable us to carry out estimates about product releases and capital requirements.
Going back to what we said at the beginning: each application will have its own particular mobile marketing metrics. We have described here the seven that we should all take into account. Are you making use of any others?
Still have your concerns?
Your concerns are legit, and we know how to deal with them. Hook us up for a discussion, no strings attached, and we will show how we can add value to your operations!
