Android Studio 2.0 Zeroes In On Improved Workflow

Few days back, Google launched android studio 2.0 with a better android emulator and modern instant run feature.
Google is constantly working on creating and setting up Android apps faster. And it is all possible because of the betterment of Android Studio, in which Google has recently announced its latest version, the Android Studio 2.0. It’s latest features Instant Run that can identify the changes and modifications on the Android device or emulator real-time, as well as GPU profiler.
Android Studio will ensure that proper Gradle integration is there in the developer environment to quickly make available the code changes as soon as Instant Run is permitted. The latest version makes it two times faster as the new build of the IDE. The new Android Studio 2.0 also has a significant addition, namely GPU Profile, making it easier to profile OpenGL ES Android code which is actually quite helpful to graphics-intensive apps and games.
A couple of days back, Google has previewed the version 2.0 of the software development platform, thus improving the development emulation and workflows. Making app builds and deployment faster and smoother is one of the most demanded features of people. On the occasion of Android Developer Summit, the announcement about a preview of Android Studio 2.0 featuring Instant Run was made. In the upcoming days, it is going to significantly enhance android developer’s development workflow. Using the Instant Run lets developers have a quick look on the changes running on a device or emulator.
Now it’s the time to get the best office apps for the Android devices, and exploring twelve incredible Lollipop APIs that every Android developer is going to love. More new updates and news related to mobile development may be announced in upcoming days.
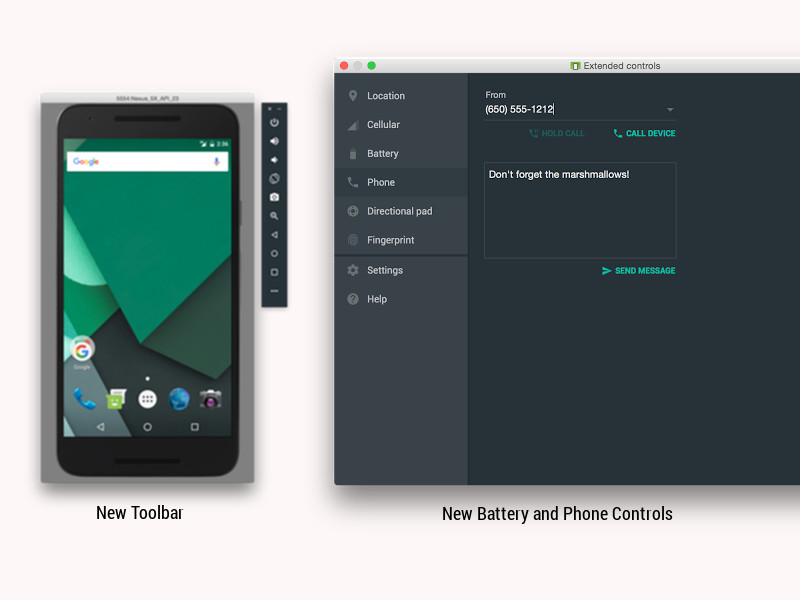
The faster version of Android Studio 2.0 is backed up with a latest user interface exposing common emulator actions incorporated in a toolbar, with some extra controls in another window. Now users don’t have to only depend on command-line options. As for the preview, the new Android emulator toolbar allows such actions as screen rotation, volume control, screenshots and windows zooming of the emulator window. The new update allows easily dragging and dropping APKs directly on to the window and also rescale the window by simply dragging the emulator window’s corner.
With the assistance of the GPU Profiler tool available in version 2.0 makes it much easier to profile Open Graphics Library (OpenGL) ES code in Android. Although the profiler is still under early preview stage but displays the information regarding the GL state and commands and allows developers to easily record the complete sessions. The technologies have given the developers facility to walk through the GL Framebuffer and Textures as an app is handling OpenGL ES code. If the developer wants to access the profiler, they will need to download GPU debugging tools which are available in the Android Studio SDK Manager.
Currently, Android Studio 2.0 preview can be accessed in the Android Studio Canary Channel. Whereas in the early next year, there is a plan for a stable release.

Still have your concerns?
Your concerns are legit, and we know how to deal with them. Hook us up for a discussion, no strings attached, and we will show how we can add value to your operations!